

Let me start by saying that Aria operation manager is a great tool and there are various blog articles on the tool by my colleagues and the entire tech community using vROPS. But in this blog I am going to specifically write on the vROPS capability of IT infrastructure capacity management.
vROPS has great capabilities when it comes to capacity management, I am just going to explore these capabilities a little more the way i used them for some of the use cases i dealt with. Lets start with brief understanding about background of the vROPS capacity management engine.
Capacity analytics uses the capacity engine to assess historical trends, which include utilization peaks. The engine chooses an appropriate projection model to predict the future workload. The amount of historical data that is considered depends on the amount of historical utilization data.
The projection window for the capacity engine is 1 year into the future.
– The engine consumes data points every 5 minutes to ensure real-time calculation of output metrics.
– Capacity calculations are based on the time remaining risk level.
– The engine considers the upper bound projection for a conservative risk level and the mean of the upper bound projection and lower bound projection for an aggressive risk level
Key Metrics
Time Remaining-The number of days remaining till the projected utilization crosses the threshold for the usable capacity. The usable capacity is the total capacity excluding the HA settings.
Capacity Remaining – The largest difference between the usable capacity and the projected utilization between now and 3 days into the future. If the projected utilization is above 100% of the usable capacity, the capacity remaining is 0.
Recommended Size – The maximum projected utilization for the projection period from the current time to 30 days after the warning threshold value for time remaining.
Recommended Total Capacity – The maximum projected utilization for the projection period from the current time to 30 days after the warning threshold value for time remaining. The recommended total capacity includes HA settings.
The engine constantly modifies projections and chooses the model that best fits the pattern of historical data. The projection range predicts the general usage pattern that covers 90% of the future data points.
Projection Models
Examples of linear models are linear regression and autoregressive moving average (ARMA).
Linear Models – Models that have a steadily increasing or decreasing trend. Multiple linear models run in parallel and the capacity engine chooses the best model.
Periodic Models – Models that discover periodicity of various lengths, such as hours, days, weeks, months, or the last day of the week or month. These models ignore random noise. Examples of periodic models are fast Fourier transforms (FFTs), pulses (edge detection), and wavelets.
Comparison between Aggressive vs Conservative Risk Level Setting
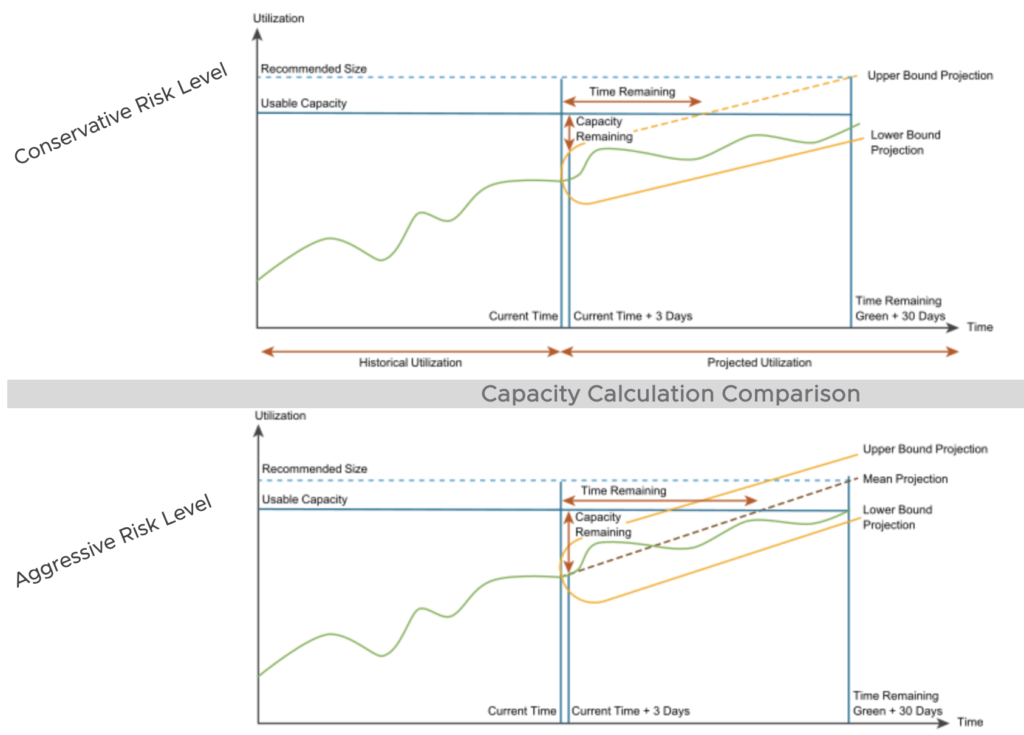
The comparison shows with conservative risk level set, the remaining capacity levels are low as compared to the aggressive capacity level.
This is all about the summary of the vROPS capacity management engine and how it derives the numbers for utilisation and projections. I will continue this series with deep dive into various topics and custom dashboards.. stay tuned..