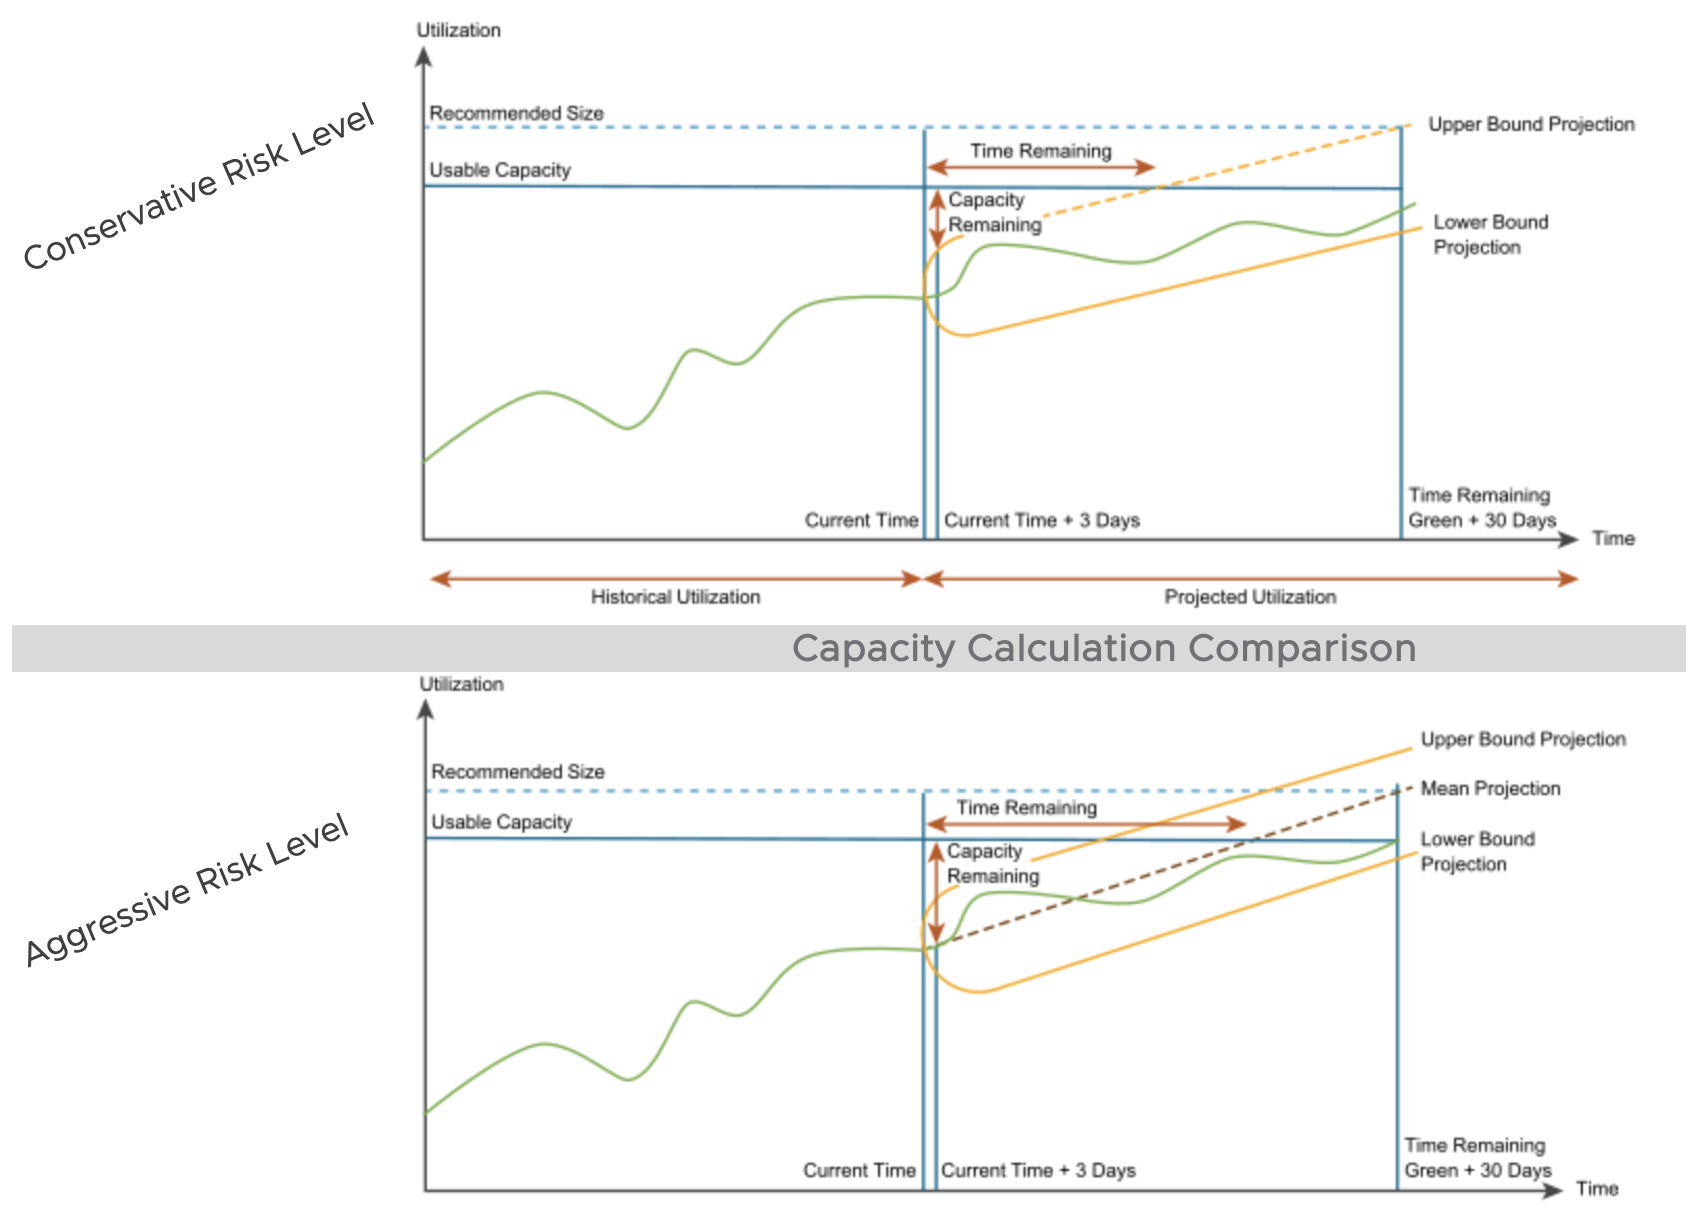


Operations manager and capacity managers have different views when it comes to the Reclamation and Rightsizing of resources for Virtual machines. Capacity managers will always ensure that the VM’s have enough resources to run when they need them.
So to decide on the reclamation of the resources, it is very important to look at the historical data as well as the projections in the future. In general, people tend to look at the average utilization or demand trend for CPU and memory resources to decide on the reclaim numbers. However this can go really wrong if you are taking a timeframe of 6 months ore more for data analysis. The average for large data set tend to be much lower than for smaller data set mathematically.
In this case it is recommended to use percentile as a metric for demand/ utilization metrics, this will ensure that calculations are not skewed for corner cases nor they are putting a lot of emphasis on the peak values.
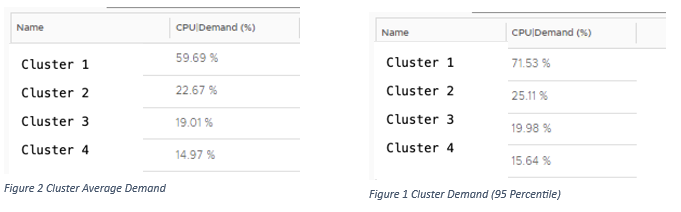
The tables above clearly shows the difference between the average and 95 percentile numbers. In addition to these numbers, charting a trend of peak vs average demand numbers would aid into the decision making since you get a comparison of the data side by side.
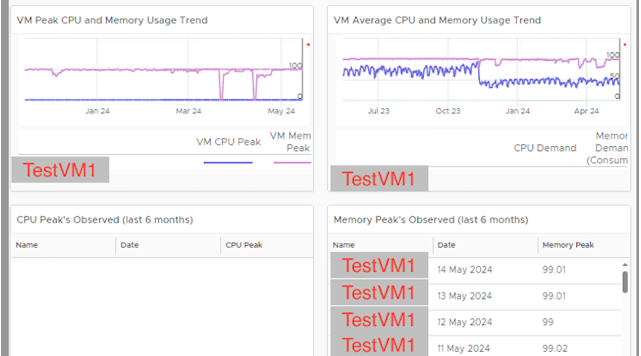
Lets take an example of a VM, The picture below shows the Average vs Peak utilization of the VM and CPU. From both charts its quite evident that memory was peaking close to 100 all the time in both charts whereas CPU was close to 50% average, there are no peaks observed for CPU. The table specifically gives the data points on which days were the peaks observed. This gives pretty good insight into the historical data for making the reclaim decision.
Now another data point that would be helpful to look at would be the capacity projections in the future based on the historical consumption/ demand data.
The picture below depicts the capacity trends for CPU and Memory for the historical data as well as the projections in the future, the projections from Aria operations perspective will have more weightage in terms of the recent history and then it will have decaying importance to data as we go past in the timeline.
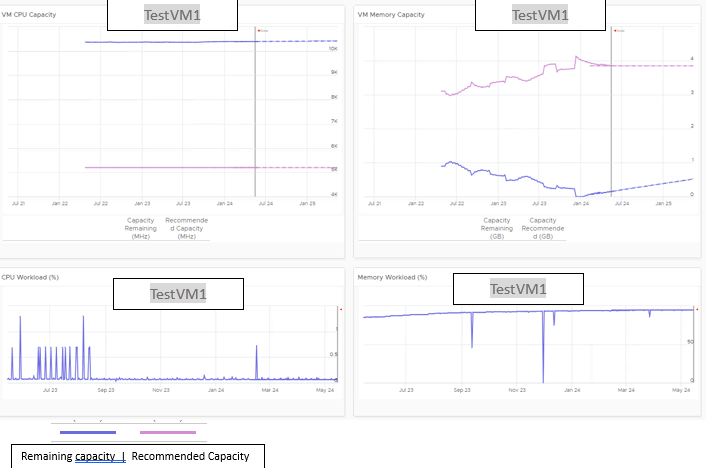
The top two charts show the data for remaining capacity and recommended capacity for the VM. The testVM1 does not have any problems with CPU capacity however we can see that the recommended capacity for memory is much higher. The memory remaining is quite low so definitely VM needs more memory. and this is quite evident from the memory workload chart where it consistently touching the 100% mark.